Sway + Neovim + Tmux + Julia: 3 Data Science Workflows
Sway + Vim + Tmux + Julia: 3 Data Science Workflows
Occasionally, I reviewed my workflow with different tools and saw if that was comfortable enough for the development process. When I was using Vim, someone pointed out that they were using it for data science, which caught my attention. I tried to experiment with different ways I could use the tool. Using Vim as a tool to replace Jupyter Notebooks first took a lot of work, mainly because I missed the experience of seeing all the plots and data in just one website and being able to scroll all around. In my experience with Julia for a data science project, there are 3 ways you can achieve a good experience with different trade-offs.
Basic ingredients.
- A Tiling Window Manager, in my case, I use Sway
- Vim
- Tmux
- Julia or any other scientific computing language
Double Pane

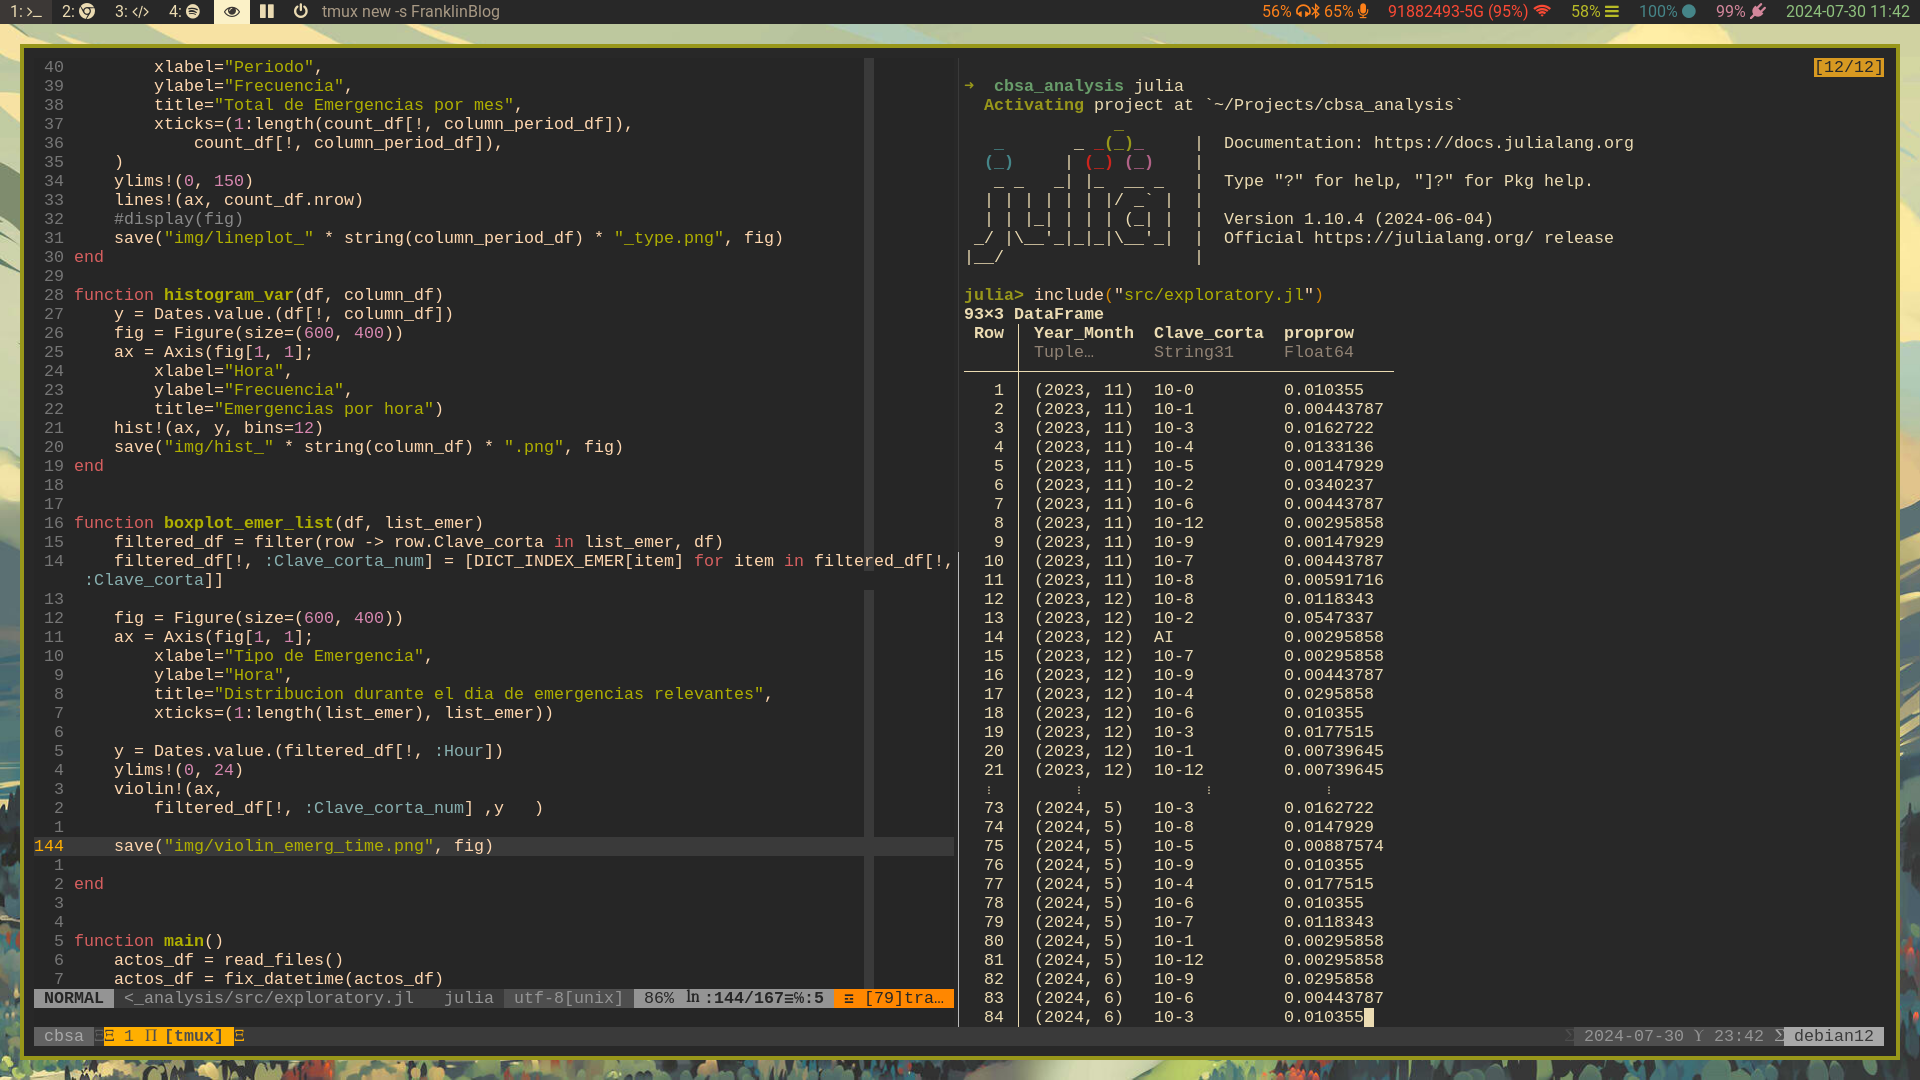
This is the one I read most of the time on Reddit. Here, you will need to install Vim-Slime or a similar “send-to-REPL” plugin. In this scenario, you will enjoy the feature of sending snippets of code to your REPL. You only need to activate Tmux, open your .jl file on one side and the REPL on the other using Tmux panes, and that’s it.
The pro is that you can run all your files or experiment with different snippets. The cons of this workflow are that you will be constrained by the space of your screen when it comes to seeing your plots because it will use half of the screen when it displays. The double pane will be shrunk, so you cannot clearly see the code and the REPL. To mitigate this, you could use UnicodePlots to see your data and plots only in the REPL without emergent windows.
I used this as a standard for a while, but it didn’t click on me when working with plots in this workflow.
One Pane
You can achieve this without using Tmux (but it is still convenient to display different sessions). Julia has a really powerful REPL, and the way you can change to Shell mode deserves more attention. Many people will not understand why that is important, but Julia’s key is to stay with the REPL activated as much as you can. If you need to shut down it and do other things, then you lose a lot of the power that Julia holds.
Some people dislike using REPL-based languages because they force you to work with workflows that deal with code snippets instead of running all your programs at once. But this is not true at all.
Similarly, you run julia my script.jl in the terminal and then open the file with Vim to keep editing, you can use the REPL to change to the Shell mode, modify your script and then come back to the Julia mode and run your script using include("myscript.jl").
In particular, you can work very well with this work and keep your workspace cleaner. However, if you are working with a script that creates several variables for data cleaning and plots, you will be annoyed to try to remember all of them; at least, that happened to me. When I close the script and run it, sometimes I want to check some results stored in specific variables and call them again, but not always remember them all. You can mitigate part of this by using a main function, saving your plots, and processing the data.
2.5 views panels
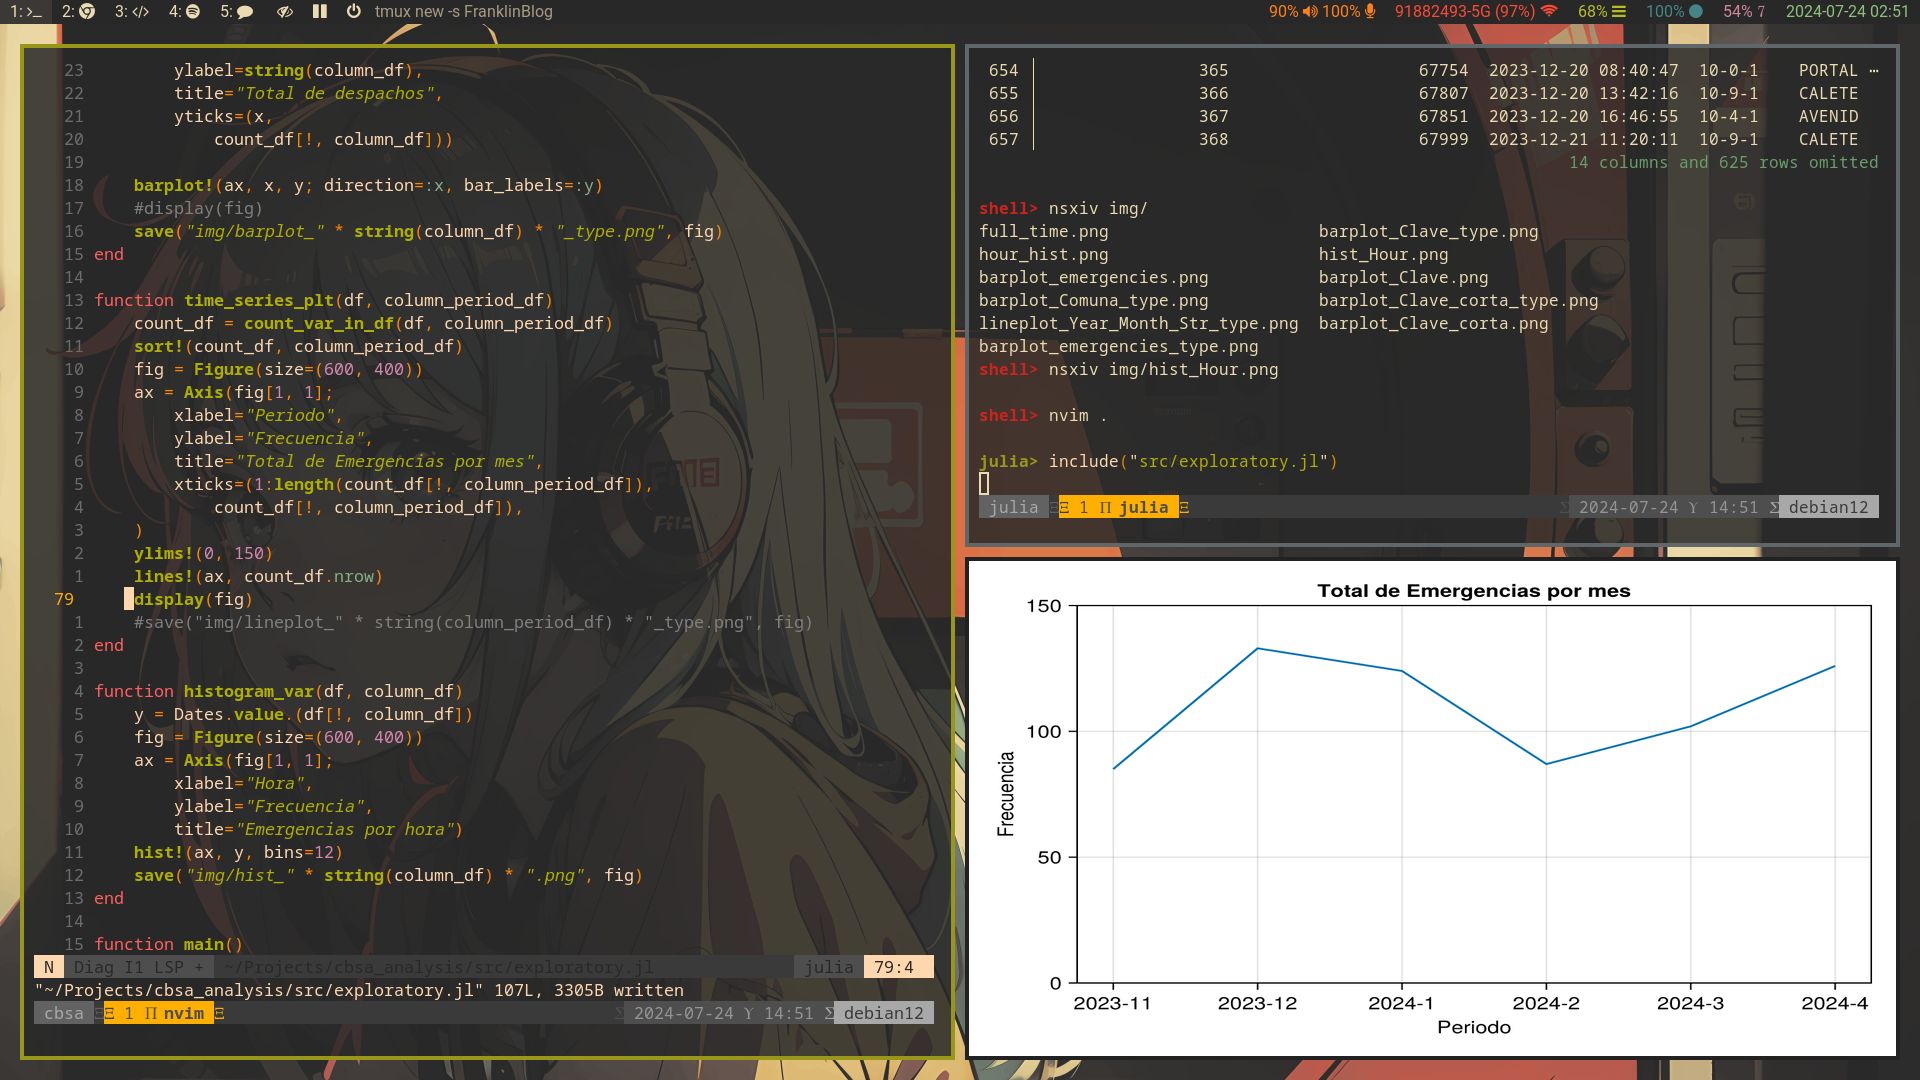
This try to replicate the experience on RStudio or VSCode you will mainly will deal with 2 panels, one with your code, and for other side The REPL, these terminals are splitted, so you are not using Tmux to open panes as in the first case.

Here is where your Tiling Windows Manager will shine in your workflow. If you set up correctly, a new emergent window will appear on your screen every time you run your script and display the plots you want to see. You can easily explore it, zoom in and out, close it, and return to work with your script. I am having a good time using sxiv from suckless to display plots. If you need to see the plots again, here is where the REPL and the Shell mode can help you; if you saved it, you could open it up using tools like Sxiv to explore your plot again.
The positive thing about this style is that you can have everything displayed in a comfortable way, see the code and the REPL clearly, and display your figures in a noninvasive way when you need to explore your figures. The bad thing about it, again this disminished the utilities of Tmux and also made you dependent of your tiling windows manager, not all work in the same way; if you use Sway or dwm, for example, you will have different experiences given the basic set up, so you will have to change the configuration to set your own needs.
Conclusion
Finally, I want to add that there is still room for improvement, and I would like to see other people’s workflows and how they deal with their data science projects. These days, I am more inclined to use the last option for this kind of project, and the first one I found more useful for software engineering, like a project where interactivity is not a central part of the process.
